
How to Learn Order Flow Trading the RIGHT Way
In this 2-part article, we’ll look at how to learn order flow trading gradually and implement it the right way – gaining benefits along the way and avoiding frustration.
There’s an aspect to reading order flow that’s a bit like playing a video game. Many video games start easy and then get harder. Each level can’t be too hard or too easy as either will cause you to lose your interest. Research has shown that when adult rats play with juvenile rats, the adult will let the juvenile win around 30% of the time – less than that and the juvenile loses interest. I just think it’s better mentally to book wins and build your confidence than shooting for the moon and falling on your face.
If you take nothing else from this article, take this – try and build in some positive feedback in your trading journey. Don’t start at level 6 and get frustrated, start at level 1 – which is…
FREE BONUS: Take a look into the decision-making process of professional traders with this video training series that helps you make smarter trading decisions.
Level 1 – Stop getting run over
I know on the surface, this doesn’t seem very sexy. You just want to know when to get in, right? This is the “anti-trade” in a way. There’s a lot of focus on looking for reasons to get into a trade, but very little on reasons to NOT get into a trade. So there’s 2 skills here – one is reading the Order Flow, the other is letting go of that trade – put that quarter back in your pocket and sit this game of space-invaders out, even though you’ve been queueing up for an hour (yeah – back in the 1900s, we had to go to an arcade to play video games).
The ability to read momentum in Order Flow is a bit like learning to cross the road. Or very much like the Arcade Classic Frogger, which you can play here (just use the arrow keys to play). Give it a try, it’ll help. You are trying to gauge the momentum as price comes towards your entry price. You will do one of 3 things:
- Take the trade at the entry price.
- Take the trade at a new price – this could be at a better or worse price. For instance, if it appears that the momentum very low, then maybe it won’t even make it to your entry price. Or the momentum could be so fast you wait a little and get in at a better price when things have calmed down.
- Not take the trade – which is often made trickier by your desire to take a trade, feeling that you NEED to trade.
In other words – fewer trades that immediately and forcefully run against you after entering. Sure – it’s not as sexy as a “reason to get into a trade” – but it’ll make the difference between a Camry and a Courvette.
Now – the tricky thing is – nobody can tell you how to do it. Like crossing the road, nobody sat you down and explained the physics of stopping distances, if you are lucky – a parent held your hand and repeated the process with you and you learnt through repetition, not theory.
To help you adopt this skill and learn order flow trading, here’s our video on momentum drills, focused on accepting/rejecting trades.
Level 2 – Volatility Meter
Unless you’ve just started out, you’ll know that to learn order flow trading, one thing that is absolutely consistent in the markets is that volatility (and therefore risk and opportunity) changes every day. Your job as a trader is to take advantage of the opportunity the market makes available to you, while at the same time mitigating your risk. Part of ‘being at one’ with volatility is keeping your eye on the news in the morning, just being situationally aware. News has the potential to create market activity, but it’s no guarantee market participants will react in a certain way – which is why news traders heavily rely on Order Flow to confirm if the market is reacting as expected. So sure – use the News and the VIX – for indications of volatility but confirm with Order Flow.
You can assess volatility at any time but my preference is to focus on the opening minutes. There’s arguments that say it’s better to do it at 10am – when things have calmed down but I find the open to be a good indicator as to how the day will go. Plus, if you wait till – the range is going to tell you a lot about volatility anyway! This is about an early and accurate ‘heads up’ at the start of the day. Overnight range is a good indicator – but the amount of participants in US hours dwarfs the overnight trading volume, so I think you’ll still be left with the question “but how are US participants trading?”.
This is a skill that takes a little longer to adopt, not because it’s hard but because there’s only 1 open a day, so only 1 time each day to work on it.
If you did play Frogger, you probably got hit by a car in the first or second lane. Now, imagine it running at 20x speed, you’d see the difference immediately. You’d recall how it looked the first time you played and when you see it at 20x – you’d see there’s a huge difference. You wouldn’t be able to tell it’s 20x specifically, but you would see that it’s way faster.
You acquire this skill by watching the open each day on your market(s). Watch Depth & Sales as the market opens and just observe it. You are likely at the screen anyway at that time, so it’s zero cost.
On some days, you will see terrible low-volatility, low opportunity action and you’ll go do something else for the day. Of course, this will only happen after you try and trade low opportunity days and spend 8 hours losing a tick and paying the broker. On other days you’ll see high volatility and know to tweak your size/stops/targets as necessary OR chase different trades. If you have an 8 tick stop and volatility doubles – you will get taken out of most of your trades, not by being wrong about the trade but by being wrong about how much ‘wiggle room’ it needs to play out.
In terms of doing the actual adjustments to stops and targets. That’s not something you will have to do every day, if the shift in volatility off the open is small/subtle/hard to perceive – everything stays the same. What you are looking for are significant changes. Changes that make you say “Holy Moly – this is a wild day” are what you are looking for – big, obvious stuff.
And there’s a bonus – if you do this, not only will you be more in tune to shifts in volatility – you can often take trades at that time because of an observed behavior around overnight volume (which is explained in a video you get with daytradr professional ). Just walk before you run, OK?
Level 3 – Reading Pullbacks
I love pullbacks, I feel that some pullbacks have a good R:R because they such low participation, there’s no opportunity for larger players to nudge people out of position. If we put in a low for the day and are still close to it – we KNOW there’s gonna be a ton of stops underneath it and that’s where people that nudge the market around make money. Profitability depends on the stops firing. On the other hand, you don’t have that with a low-volume pullback – there’s not enough stops underneath it to warrant spending money on nudging it down.
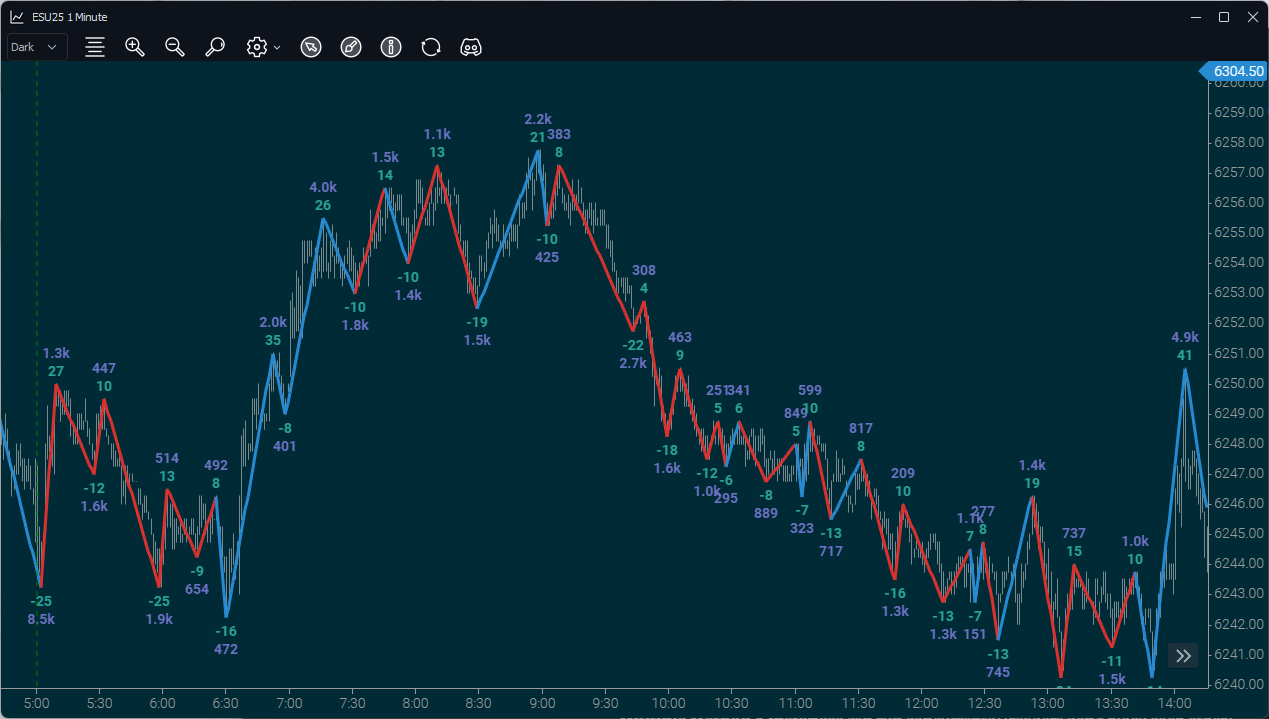
Before I explain the mechanics of reading pullbacks, let’s get oriented with the chart and in turn about the mechanics of pullbacks and reversals.
- This is a 1 minute chart, compressed enough so you can’t see the individual bars – that is intentional. What remains is “where it went and where it turned” – which is really all you need.
- Green numbers are number of ticks in the swing, purple numbers represent the volume in the swing.
- The swings are blue/red. Blue – if it’s an upswing and the volume is greater than the volume on the last downswing. If it’s a downswing and the volume is less than the last upswing, it’s also blue. Reverse that for red.
- Look at the size/number of ticks in the upswings and downswing – you can see that in the trend up from 6:30, upswings were bigger and had more volume than downswings. Then it reverses after 9:30 and now the downswings are bigger/more volume than upswings.
- Look at the first up swing from 6:30 – the number of ticks and volume are significantly larger than any prior downswing.
- Look at the first red downswing at around 9am. You can see 22 ticks and 2.7k volume.
This chart is a pullback traders dream. It is consistent that almost every time the market reverses, the first swing in the reversal is significantly larger and more voluminous than prior swings. You want to estimate if a market has turned and now it’s time to stalk trades in the opposite direction – this is the best way I know to do it. You could also rely on cumulative delta for this on the ES – but that’s no longer the case since COVID, the great liquidity sdwindle.
So why is Level 3 pullbacks? Well let’s consider 3-6 to put it into perspective:
- Level 3 – Trading Pullbacks
- Level 4 – Sitting in a trade through “with trend moves”
- Level 5 – Sitting in a trade through multiple with/counter trend moves (legs)
- Level 6 – Trading a news event (added volatility)
As we’ve seen – pullbacks are lower volume (and lower energy) events. Trouble is – you won’t know the volume till the pullback is finished. The upside is that the pullbacks do trade and end in observable ways (discussed in depth in the Jigsaw education).
Now – let’s say your trades have a target of 30 points on the ES. When you get to Level 3 – you are only reading pullbacks. Or rather – that’s the current level of skill you are working on, you should not attempt to manage your trades through multiple upswings/downswings. If you dive straight into that – chances are you’ll get spooked out well before your 30 point target. If you want to dive into the nitty gritty of the theory of pullbacks and reversals – check out this olden but golden video from Jigsaw.
From an order flow perspective – you’ll focus on 2 things.
- Assess if this really looks like a pullback. The move might be the same pace in terms of number of ticks per session moved (although it’s often slower) but the volume on the countertrend side will be way lower.
- Nail the entry – often we just get to a point and no more countertrend traders are available but sometimes we see the pullback end with a nice iceberg order/absorption.
This “does this really look like a pullback” and “does it look like a with trend move” – that’s half the battle with Order Flow. They are 2 sides of the same coin, but honestly – I could have saved 6 months with Order Flow if I’d been advised to do this!
So – even if you don’t trade pullbacks, this is still the way to go – pullbacks give you a tamer training ground to read order flow – I mean – there’s literally fewer orders in them.
In Part 2 – we discuss the remaining events to learn order flow trading the right way. Click HERE for Part 2.


Thank You! Very useful. The education on the Jigsaw sites are the best. My trading has blossomed since my professional version in September 2024.
As far as one opportunity per day to observe the open, that is true but I've also taken to recording the things I want to study and giving them the once over a few more times as I rarely learn enough with one viewing, even with notes. It seems a truism is that the markets rhyme but don't repeat. Thanks for sharing your experience and observations.
Do you have the link to the pullback education that is mentioned; as you say “pullbacks do trade and end in observable ways”, I would to know what these are
Thanks
Thanks for putting in the effort to write this.