Jigsaw Trading Blog

daytradr Charts Beta 4 – CSI, Memory Improvements

All, it’s time for another release of the charts. In this version we have CSI that we first introduced as an indicator for NinjaTrader 7 way back in 2015. This is being released as a chart type, not an indicator/study. It’s just easier to use that way.

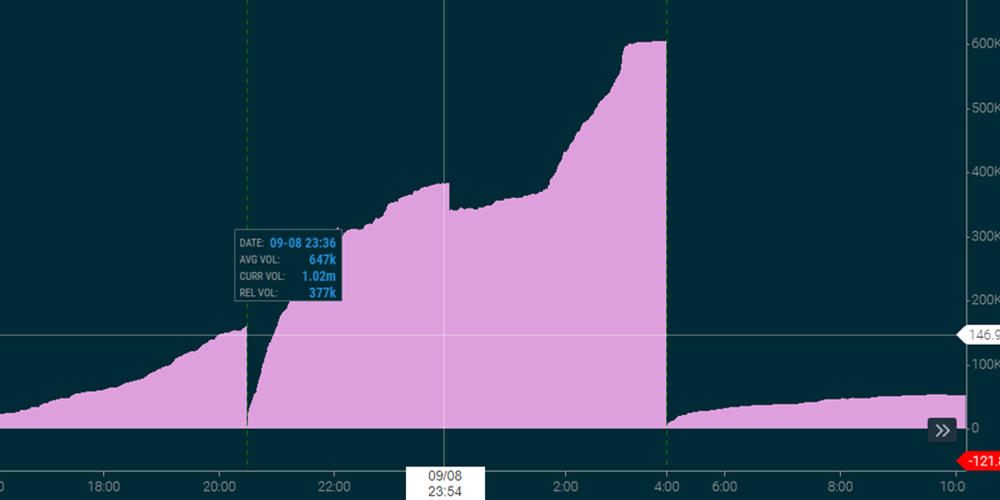
CSI (Cumulative Sheep Index) aka Relative Volume

This shows volume at the time of day relative to the prior n days. In my case, In this release, we look back 30 days. In the above image, we can see that we are now 4415 contracts below the 60 day average for the time of day. This is very useful in terms of identifying when volume is picking up or slowing down. The absolute value is not as important as whether it is rising or falling. As participation changes, the price action changes too. In my opinion, this is one of the best ways to analyze volume/participation in the markets.

CSI

Note that we didn’t yet add support for continuous contracts so average volume for December contracts will be low. This is on the way, keep the lookback perionds shorter for now.

Memory Utilization

We have made improvements in memory utilization. In the last version the Volume Profile data was sent to all charts. That made them a bit ‘spendy’ in terms of memory. Now, we don’t load it until you request JTVolumeProfile – which means it’ll take a few seconds to reload the data when you add that.

Font Sizes for Price/Time Scale

Each chart now allows you to set the font of the price scale which defaults to 14 – which is larger than before. 

Chrome Resizing ‘Glitch’

Our product is a hybrid desktop/cloud app, with charts and news being cloud based. We use a set of open source libraries to embed this and we found a major glitch where if you resize a chart at the wrong time, it’ll close the app. We have created our own version of these libraries with more error handling so that in no circumstances can it crash the app.

Installer

Recently the installer was doing odd things like not creating files in My Documents folder. We gave up on fighting windows and antivirus tools and now we create missing files at startup of the app. 

Manual
A few people have asked why the manual hasn’t been updated much for charting. That’s mostly because we’d have to keep changing it as we take your suggestions on board. 

Next release will be Footprints/Cumulative Delta.

As ususal, you can download the software here: https://members.jigsawtrading.com/daytradr/


FREE BONUS: Take a look into the decision-making process of professional traders with this video training series that helps you make smarter trading decisions. (Article continues below)

Order Flow itself is simply information. Just like charts, it can be used in a number of ways, some good and some bad. But let's first break down order flow into it's components so we all agree what we are talking about:

Order Executions/Tape Reading - This aspect is the real flow of orders. It's the information we see in Time & Sales, Footprint Charts, Cumulative Delta. It is looking at market orders, either as they execute or historically. I guess this is the "true order flow". Every trade is a buy and a sell. We look at market orders because we consider them to be more aggressive. When someone trades with a market orders, they are giving up a price to get an instant fill. Limit orders on the other hand just lazily sit there waiting for a market order to hit them. Often these are market makers with no directional conviction. So we see market orders as being more significant.

But we don't use these in isolation.

Volume Profile/Positions - The tape reading part helps us assess various things like momentum, traders getting stuck, balance of trade BUT the volume profile helps us understand where people are positioned and likely to get stopped out. I sometimes call this "Order Flew". It's important to know when trades will be "washed out" - for example - if we have a volume cluster on the S&P500 Futures and the market moves up 100 points and back down to it, it's unlikely short term traders on either side that were positioned there will still be there. But recent, nearby volume helps us assess areas of positions.

Market Depth - The bids and offers, the lazy passive orders waiting to be hit. This is part of the story but in terms of overall importance, I'd put it at around 20% at most. For example - if you return to the high of the day on any market, the offers will be quite large directly above the high. It means nothing at all. It's just a quirk of the market. It does not help you tell if a price will hold. On the other hand, if you see large depth and as we approach it, we see more added to the depth in front of that price, it means others are front running that depth and that is a useful bit of information.

This is the key - it is all just information. Just like price charts are information. When people look at Order Flow, they consider it to be a technique more than a set of information. They look for things like iceberg orders and decide to make a one rule trading system to fade every iceberg, For these people - yes, order flow trading is overrated because they are trying to ignore everything else going on in the markets and construct a trading system a chimp could execute.

For those looking to improve a decent trading approach, the best thing to focus on in Order Flow is momentum. Once you can read momentum you can:

  • Avoid getting into positions when momentum is against you.
  • Confirm trades are working after entry when momentum goes your way.
  • Exit trades in profit when momentum fades.

That's perhaps the easiest way to use order flow because momentum is easier to read. It's about the market continuing to do what it's already doing. On the other hand, reading a turn in the market with order flow takes a higher level of skill and a little longer to learn.

Order flow can't put lipstick on a pig. It won't help you 'improve' something that doesn't work anyway, which is why whenever someone calls me, the first thing I ask is what they are currently doing and we discuss whether they need a reset or whether it will actually help.

When Jigsaw started back in 2011 - we were one of the first in the space and certainly had the best education. It was always going to attract the underbelly of the trading education/tools world and now we see stuff out there that is so complex but so impressive and futuristic that new traders are drawn to it like moths to a flame.

So here's my advice when looking at Order Flow

  • Order Flow can't improve something that doesn't work.
  • Order Flow can be used on it's own, without charts to enter and exit the market but you also have to be able to recognize different market states that need different/altered setups. There is nothing magical about this.
  • Don't start jumping at shadows and take 50 trades an hour in your first week looking at Order Flow, be selective. It can be exciting to see cause and effect play out in front of you for the first time but don't overtrade.
  • Do drills to learn how to read it before you trade it.
  • Markets can only go up and down. Don't overcomplicate it. If you have too many Order Flow tools on your screen - you will not be able to make consistent decisions. Less is more.
  • Take time to choose a market with a pace you like. Interest rates might send you to sleep, the DAX might give you a heart attack.

It is hard to see how a set of information could be overrated. It is true that some methods of presenting this information are better than others. It is also true that some people simply get on better with different tools (e.g. Footprint vs DOM).

There's a middle ground between complexity and simplicity that will leave you making consistent decisions where you improve over time. For those people, Order Flow will be way underrated because they will be the one's getting the most out of it.

Those that jump in with both feet on day one and those that have 100 different tools up, for those, it's a painful experience.

Keep it simple and manageable. Start with momentum reading and build from there. You will never look back.

Read more articles about trading

Trojans & Security

Trojans & Security

Trojans & Security Published on: April 15, 2025 We recently posted about new security features in version 5.0.0.4 of daytradr. These changes were made in response to security threats mainly from China but also the Middle East. Some of these changes have started to...

Workshop recording: Mastering the Metrics that Matter in Trading

Workshop recording: Mastering the Metrics that Matter in Trading

Workshop recording: Mastering the Metrics that Matter in Trading Published on: August 28, 2024 Are you tired of focusing on the wrong metrics in your trading journey? Do you wonder how professional traders consistently outperform the market despite seemingly low win...

0 Comments

Submit a Comment

Your email address will not be published. Required fields are marked *

Copyright Jigsaw Trading © 2025

Privacy Policy

Futures and forex trading contains substantial risk and is not for every investor. An investor could potentially lose all or more than the initial investment. Risk capital is money that can be lost without jeopardizing ones’ financial security or life style. Only risk capital should be used for trading and only those with sufficient risk capital should consider trading. Past performance is not necessarily indicative of future results.

Testimonials appearing on this website may not be representative of other clients or customers and is not a guarantee of future performance or success.

Jigsaw Leaderboard
Note that the Jigsaw Leaderboard contains a mixture of SIM/Live Traders. For many traders, you can click by their name to see the trades along with the SIM/Live designation.

The following is a mandatory disclaimer for SIM Trading results:

HYPOTHETICAL PERFORMANCE RESULTS HAVE MANY INHERENT LIMITATIONS, SOME OF WHICH ARE DESCRIBED BELOW. NO REPRESENTATION IS BEING MADE THAT ANY ACCOUNT WILL OR IS LIKELY TO ACHIEVE PROFITS OR LOSSES SIMILAR TO THOSE SHOWN; IN FACT, THERE ARE FREQUENTLY SHARP DIFFERENCES BETWEEN HYPOTHETICAL PERFORMANCE RESULTS AND THE ACTUAL RESULTS SUBSEQUENTLY ACHIEVED BY ANY PARTICULAR TRADING PROGRAM. ONE OF THE LIMITATIONS OF HYPOTHETICAL PERFORMANCE RESULTS IS THAT THEY ARE GENERALLY PREPARED WITH THE BENEFIT OF HINDSIGHT. IN ADDITION, HYPOTHETICAL TRADING DOES NOT INVOLVE FINANCIAL RISK, AND NO HYPOTHETICAL TRADING RECORD CAN COMPLETELY ACCOUNT FOR THE IMPACT OF FINANCIAL RISK OF ACTUAL TRADING. FOR EXAMPLE, THE ABILITY TO WITHSTAND LOSSES OR TO ADHERE TO A PARTICULAR TRADING PROGRAM IN SPITE OF TRADING LOSSES ARE MATERIAL POINTS WHICH CAN ALSO ADVERSELY AFFECT ACTUAL TRADING RESULTS. THERE ARE NUMEROUS OTHER FACTORS RELATED TO THE MARKETS IN GENERAL OR TO THE IMPLEMENTATION OF ANY SPECIFIC TRADING PROGRAM WHICH CANNOT BE FULLY ACCOUNTED FOR IN THE PREPARATION OF HYPOTHETICAL PERFORMANCE RESULTS AND ALL WHICH CAN ADVERSELY AFFECT TRADING RESULTS.