
Market Mechanics – Understanding How Prices Move in The Markets
“Why does price move?” is an interesting question that traders spend very little time contemplating. Traders tend to accept that price moves around in a semi-orderly fashion without worrying about the mechanics behind a price move. Why does the price of any market move at all? Why doesn’t it stay in one place? Why doesn’t it jump around at random? Why doesn’t the emini S&P500 (ES) trade at 2100.25 one minute, 999.75 the next, then 10,000.00 the next? It’s all about market mechanics.
FREE BONUS: Take a look into the decision-making process of professional traders with this video training series that helps you make smarter trading decisions.
Some people say price movements are all about supply and demand, but supply and demand for what? In futures markets, contracts get created and destroyed as people trade, so supply is infinite. How does supply and demand work there? Stocks, of course, have a finite number of shares issued; scarcity is a potential factor, but couldn’t possibly be behind every move up.
Some people say the price moves up because there are more buyers than sellers, but this isn’t possible. The exchanges we trade on exist to match buyers and sellers. A trade only occurs when both are present; every trade is a buy and a sell. The number of buyers and sellers is equal.
So, what mystical force is causing prices to move in an orderly manner and is causing different markets to move at a different pace? What causes Crude Oil to be more volatile than the equity indices?
The answer, of course, is “Liquidity”.
Imagine for a minute that the market is a hi-rise building – but one without stairs. Price can move up when the ceiling above it is broken, and it can move down when the floor below is broken. The market also has a ceiling above and a floor below. This is in the form of limit orders, and this is what we refer to when we talk of “liquidity”. In the market, some floors/ceilings are thicker than others (US Treasuries) and some are thinner than others (Nasdaq, Crude Oil).
Something needs to ‘eat’ these ceilings for prices to move up. The eater of liquidity is called a “market order”. When someone submits a market order to the market, it eats some liquidity and makes that floor/ceiling a little bit thinner. Once it is completely eaten away, the price progress, and the next floor/ceiling starts to be consumed.
At this point, it’s probably worth pointing out that in any market, there are 3 prices. The price we see on our charts is the last traded price, that’s history, it is not the price we’ll pay if we buy or sell. The prices we buy and sell are the inside bid and inside offer. So at any time, there’s a price we pay if we want to sell right now and a different price we’ll pay if we want to buy right now.
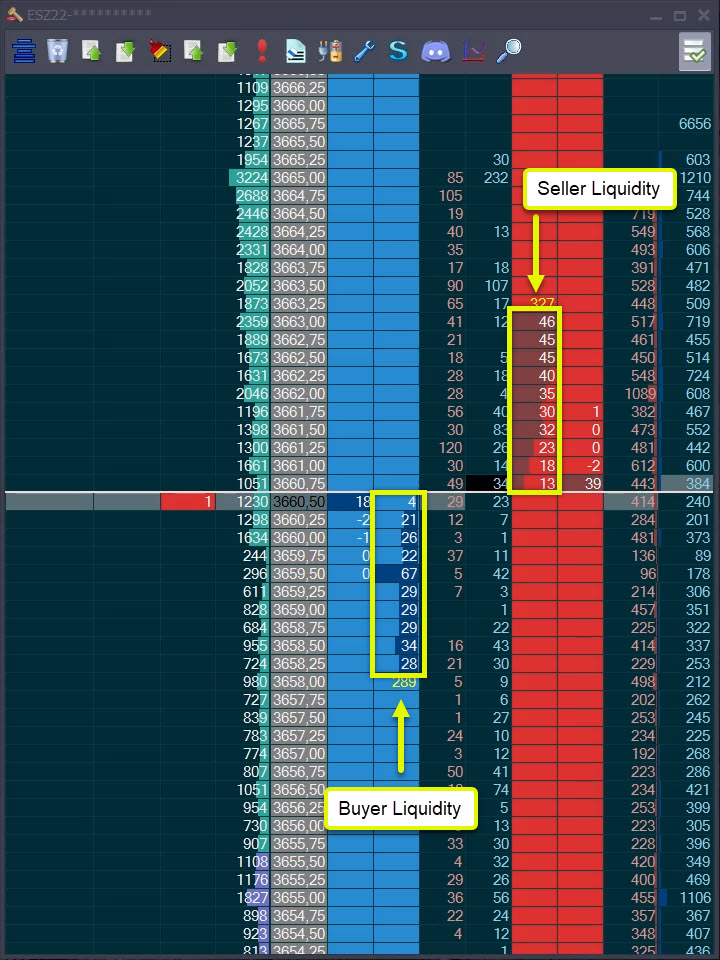
Image 1 – Bids and Offers, buy side and sell side liquidity (Jigsaw Depth & Sales)
In Image 1 we can see:
- Last traded price was 3660.50
- Inside Bid Price – the price you will pay if you submit a market sell order – 3660.50
- Inside Offer (or Inside Ask) Price – the price you will pay if you submit a market buy order – 3660.75
For the price to move down from this point, we need more than 4 sell market orders to ‘consume’ those inside bids. At that point, the inside bid would then be 3660.25. Similarly, for the price to move up from this point, we’d need more than 13 buy market orders to ‘consume’ the offers. At that point, 3661.00 would become the inside offer.
This does not mean that we can look at the liquidity and determine where the market will go next. Some liquidity is fake and disappears when the price gets close to it (a practice known as spoofing). Some liquidity is hidden and increases when we trade there. Understanding market mechanics is key.
Trapped Traders
If you look at the 8th and 9th columns from the left, you can see the number of sell market orders (light red) and the buy market orders (light blue) that traded at those prices. We can see that at the top, we traded 232 buy market orders at 3665.00, and then only 30 more buy market orders were able to trade, and immediately reversed back down. We couldn’t go any higher. Buyers were consuming the sell side liquidity but in this case, as they were consuming the liquidity, the sellers were adding more and more. The buyers at that price got trapped and eventually price started to descend, partly as a result of those buyers exiting the market with sell market orders (stops) that consumed buy-side liquidity.
Liquidity is an important piece of the puzzle, but so is the result of liquidity consumption. If buyers consume sell-side liquidity and the price doesn’t move up, they get trapped. In thicker markets, this sort of trap can occur at a single price, but in thinner markets like Crude Oil, it’ll typically happen over a consecutive series of prices. On its own, the consumption of liquidity not being able to break through a price is a significant Order Flow event, and in context, it can give you a trigger to enter a trade. The upside is that if the trade fails – you know about it, just the other side of where it appeared that the buyers were trapped. If they break through the level, they aren’t trapped. Even if you don’t win every trade, the risk-to-reward ratio is excellent.
Pullbacks & Liquidity Vacuums
The liquidity consumption model doesn’t just help when considering prices ahead of us. There are significant implications in studying what occurs ‘behind’ a move. Just like the wake behind a boat, a move in one direction leaves ‘ripples’ in the liquidity behind the move. Sell-side liquidity exists above us and buy-side liquidity exists below us. Your DOM may only show 5, 10, or 20 levels of liquidity, but that doesn’t mean there’s no liquidity outside of that. There is plenty of buy-side liquidity below the 10 levels we see on the DOM, and plenty of sell-side liquidity above the 10 levels we see. But there is definitely no buy-side liquidity above current prices, and there is no sell-side liquidity below current prices.
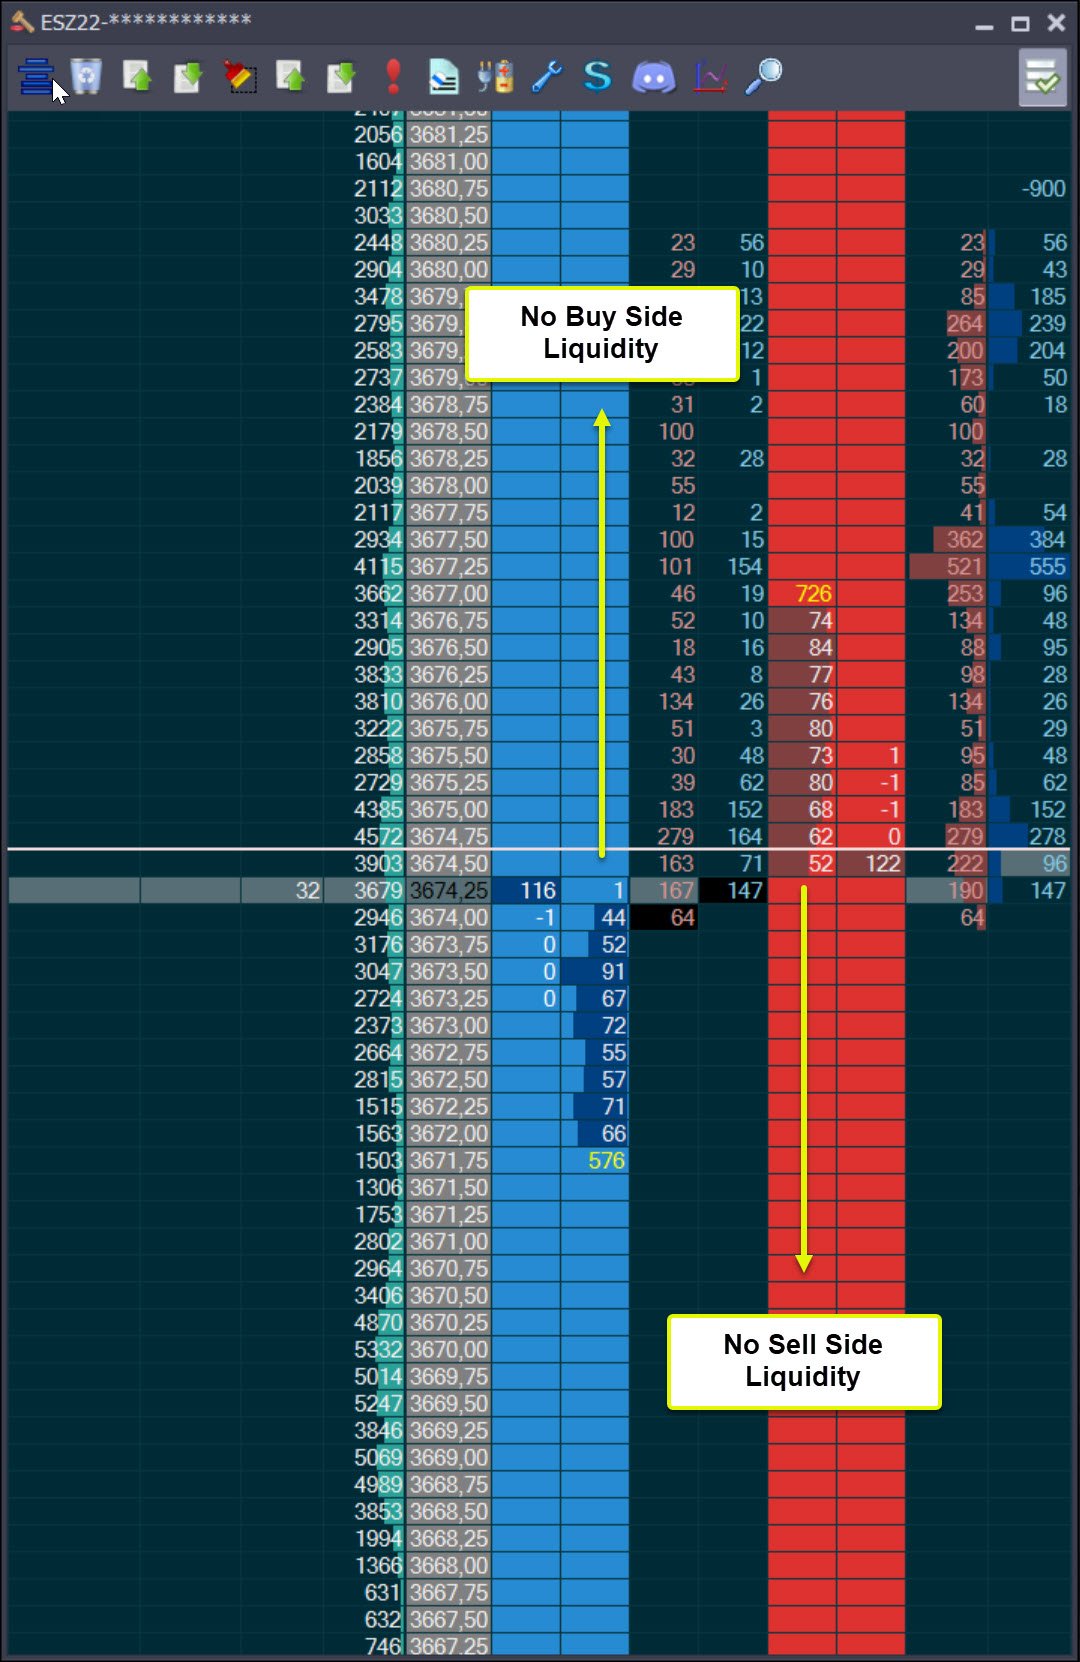
Image 2 – No bids above us, no offers below us (Jigsaw Depth & Sales)
In image 2, we can see there are no bids above 3674.25. Any bid above 3674.25 would be turned into a market order and executed immediately (it’s an ‘actionable’ order). As the market moves up, we move up into an area where there is no buy-side liquidity. The ceilings we just broke through are now the floors below us, and it takes time for those floors to ‘repair’. Quite simply, it takes time for traders to put in new bids at the new higher prices. Whilst those repairs are underway, there is a relative imbalance – the market moved up into an area where there are thick well-established ceilings above whilst below you are very thin and fragile floors.
There are a couple of reasons this is of interest. First, if we look at a move, we can surmise that a fast move up will leave a bigger relative liquidity vacuum in its wake than a slow grind up where there is more time for the liquidity to repair behind us. When the price does pull back (say, in an overall up move), we can assess the volume and quantity of market orders on the way down and if it’s relatively weak, we can presume this is a move down into a liquidity vacuum caused by lack of floors below rather than a mass of sellers coming in and consuming buy-side liquidity. That being the case, it’s more likely that the price will continue upwards once a solid floor is found.
A relative lack of buy-side liquidity builds behind a move up and a market will get sucked back into the vacuum created with a move down that has relatively low volume, it then hits some buy-side liquidity, and it finds a floor. Then the overall move continues back up again. It’s all about market mechanics.
Liquidity and Predicting Volatility
Understanding liquidity helps us to understand why price moves. It also helps us to predict and identify pullbacks. It helps us to understand that it’s slow moves that allow liquidity to build in its wake, and that rapid moves tend to drop back just as rapidly into a larger vacuum. As useful as all of this is, observing liquidity has even more to offer.
Changes in liquidity lead to changes in volatility (as there is more or less liquidity to consume), simply looking at your DOM every five minutes will give you a feel for how much liquidity is normal and a heads-up when the market gets thicker (more liquidity, less volatility) or thinner (less liquidity, more volatility). Quite often, you can tell how volatile a market will be in the first few minutes of trading because of observable excesses in liquidity. As the market changes pace from time to time, it’s the liquidity that gives you the heads-up that this is happening. In fact, it’s the changes in liquidity that causes the market to shift gears.
Changes in liquidity also occur at key price levels. At a major area of resistance, the offers above that resistance WILL be significantly thicker. Directly below support, the bid will be significantly thicker. This doesn’t guarantee that price will reverse there; it actually means that other traders are holding the opinion that this is a key level. After all, a market isn’t going to turn around if it’s just you that considers an area to be resistance, so it’s always good to know there’s a crowd there. It backs up your analysis.
Liquidity will also reduce drastically ahead of a news release. Sometimes, you may have missed the schedule for a news release or there may be something else happening that hasn’t caught your attention. When the liquidity disappears suddenly, it’s a heads-up that the market is about to become very volatile and if you are in a trade without too much breathing room – it may be time to get out so that you don’t risk being on the wrong side of that volatile move.
Floors & Ceilings
If this is your first introduction to liquidity consumption concepts, just think about floors & ceilings. We can only move up by breaking through the ceiling and down by breaking through the floor. The thickness of the floors and ceilings determines how volatile trade will be.
It’s a simple model that helps us to understand market mechanics, and why prices move the way they do.


0 Comments